This site is a great place for me (@mifsee)が個人的に学びながら企業分析や銘柄分析を進め、その過程を記録としてまとめているものです。
あくまで個人の調査・整理を目的とした内容であり、誤りや実際と異なる情報が含まれる可能性があります。
また、MifseeではAI技術を活用した運用や、技術習得を目的とした実験的な取り組みも行っています。ご覧いただく際には、その点をご理解のうえご利用ください。
▼An audio-converted podcast version by AI can be found here. (Play on Spotify)
- Introduction.
- What are the characteristics of the QQQ ETF?
- Why is the ticker QQQ? What does it mean?
- Who is Invesco, the investment management company?
- What kind of index is the NASDAQ 100 Index?
- Why is QQQ a "growth company" concentrated ETF?
- What are the components of the QQQ?
- What are the QQQ sector ratios?
- How does the QQQ operation work?
- What is QQQ's expense ratio?
- What is QQQ's dividend yield?
- QQQ's current share price and long-term chart
- What is the difference between QQQ and QQQM? Which should I choose?
- What is the difference between QQQJ and QQQS?
- Comparison chart of the differences between QQQ, QQQM, QQQJ, and QQQS
- What are the advantages of investing in QQQ?
- What are the factors behind the article "QQQ is not recommended" and the many searches for it?
- What is the best time to invest in QQQ?
- Can QQQQ be selected as a Nisa target?
- Which NASDAQ 100-linked ETFs listed in Japan are eligible for the reserve NISA?
- What is the difference between QQQ and VOO/VGT?
- What similar ETFs are often compared to QQQ?
- Which brokerage firm can I buy QQQ shares?
- summary
Introduction.
As investment in the U.S. stock market becomes more common, Exchange Traded Funds (ETFs) are attracting attention as an easy and efficient way to achieve diversification.
Among these, "QQQ" is particularly popular as an ETF that is linked to the NASDAQ100 index and can collectively invest in global high-tech companies such as Apple, Microsoft, and NVIDIA.
However, there are actually several "sibling ETFs" or "potential replacement ETFs" for the QQQ.
In this section, we examine QQQ's ETFs in depth, systematically organize the differences between similar ETFs, and identify the characteristics of each.
We hope this information will be helpful for those who want to start investing in U.S. ETFs and those who are considering options other than QQQ in selecting a suitable investment style and ETFs.
What are the characteristics of the QQQ ETF?
QQQ is an ETF with the following characteristics
- Official name,Invesco QQQ Trust Series 1 (ticker: QQQ).
- QQQ is an exchange-traded fund (ETF) offered by U.S. asset management company Invesco
- This product aims to achieve investment results that are linked to the NASDAQ-100 Index (NASDAQ-100 Index).
- QQQQ is a leading provider of services for Apple, Microsoft, NVIDIA, Amazon, Alphabet (Google), and other companies.Major technology companies are the major components of the portfolio, with these high-tech companies accounting for approximately 501 TP3T of the portfolio.
- Average annual return over the past 10 years is approximately 18.281 TP3TAnd,Outperforms the S&P 500 IndexIndicates.
- By diversifying investments in more than 100 large-cap stocks, the Fund can invest in a group of companies with high growth potential while reducing the risk of individual companies.
- The large trading volume and ease of trading make it suitable for a wide range of investment styles, from short-term to long-term.
- While QQQ is an ETF that seeks high returns by investing in a group of companies with high growth potential, particularly in the technology sector, there are risks such as sector bias and high volatility.
Basic information about QQQ is as follows
- Investment CompanyInvesco
- settlement day: March 10, 1999
- a linked indexNASDAQ-100 Index (NASDAQ-100 Index)
- Expense Ratio: 0.20% per annum
- Total Net AssetsApproximately $255 billion (as of March 2024)
- listed marketNASDAQ: NASDAQ
- ticker symbolQQQQ
Why is the ticker QQQ? What does it mean?
The reason why the ticker for the ETF "QQQ" is "QQQ" includes the followingPractical and brand backgroundThere is a
Symbolic abbreviation as an ETF linked to the NASDAQ 100 Index
The QQQ originally appeared in 1999 as the NASDAQ100 Index Tracking Stock,Ticker "QQQ" = synonymous with NASDAQ 100-linked ETFIt was branded as a
Initially, it was also nicknamed "Cubes" and was also known as "Triple Q". The "Q" is the symbolic alphabet of NASDAQ, and a ticker with a repeated "Q" was adopted to emphasize its linkage to the NASDAQ 100.
Symbols that are impactful and easy to remember
The ticker "QQQQ."Word sense, visibility, memorabilityAll are excellent, and easily impressive to both retail investors and professionals alike, and their widespread use since the dawn of ETFs has firmly established the image of "QQQ = tech stock ETFs".
Supplement: Current official name
- Official Name:Invesco QQQ Trust, Series 1
- Abbreviations:QQQQ
- Affectionate nickname:Triple Q or Cubes
In other words, the ticker QQQ,Strong ties to the NASDAQ 100 IndexAnd,Symbolic naming with branding in mind in the marketplaceThe following is a list of the products that have been adopted as
It is a name that makes sense from both a practical and marketing standpoint.
Who is Invesco, the investment management company?
Founded in 1935, Invesco is one of the world's leading independent asset management firms based in the United States.
Headquartered in Atlanta, Georgia, the company has offices in more than 20 countries and provides investment management services to a wide range of clients, from individual investors to institutional investors.
In the ETF field, the company is particularly known for its management of NASDAQ-linked products such as QQQ (Invesco QQQ Trust), which is used by many investors as a means of accessing technology stocks.
Invesco is involved in both active and index management, and is also unique in that it has developed a variety of strategies to meet client needs.
It has also increased its presence as a major ETF provider alongside Vanguard and BlackRock (iShares), and in recent years has attracted attention for its low-cost and agile product development.
What kind of index is the NASDAQ 100 Index?
The NASDAQ-100 Index (NASDAQ-100 Index) is the largest index listed on the NASDAQ market in the United States.100 large companies in non-financial industriesIt is a stock price index composed of
Established in 1985, it is widely used as an indicator of trends in growth companies, particularly in the technology sector.
Configuration and Features
- constituent stocks: 100 large companies in the non-financial sector listed on NASDAQ.
- Excluded industries: Does not include financial industries (e.g., banks, insurance, investment firms, etc.).
- Main Sectors: information technology, telecommunication services, general consumer goods, and health care.
- Representative Constituent Companies: Apple, Microsoft, Amazon, NVIDIA, Alphabet (Google), etc.
- Index Calculation Method: Adjusted market capitalization-weighted method.
Hiring Criteria and Review
In order to be included in the NASDAQ 100 Index, the following conditions must be met
- Must be listed on the NASDAQ market.
- Must be in a non-financial industry.
- Have a certain level of liquidity and market capitalization.
The components of the index are reviewed once a year, in December. Special rebalancing may also take place if certain conditions are met.
The Nasdaq 100 Index has a high proportion of technology companies, which poses a risk of sector bias. In addition, the inclusion of a large number of growth companies tends to increase stock price volatility.
Why is QQQ a "growth company" concentrated ETF?
The QQQ is the main source ofgrowing companyThe following are the reasons why we aim to invest in
Composition of the NASDAQ 100 Index
The Nasdaq-100 Index is the Nasdaq100 large companies in non-financial industriesIn particular, it consists ofTechnology Sectoraccounted for more than half of the total, and the high weight of investments in technology companies is a characteristic of this category.
Growth potential of major components
As discussed in more detail below, the top constituents of the QQQ are based on GAFAMhigh-growth companyare included.
- Apple Inc.
- Microsoft Corp.
- NVIDIA Corp.
- Amazon.com Inc.
- Alphabet Inc (Google)
These companies are developing and delivering innovative technologies in areas such as artificial intelligence, cloud computing, semiconductors, and e-commerce.
Past Performance
QQQ over the past decade.Average annual return 18.281 TP3Tand outperforms the S&P 500 Index.
This performance reflects the growth potential of the component stocks and their investment in innovation.
Access to Innovation
QQQ is,Augmented reality, cloud computing, big data, mobile payments, streaming services, electric vehiclesand other investment opportunities in companies related to innovative themes, allowing investors to efficiently access future growth areas.
Thus, the QQQ is linked to the Nasdaq 100 Index by,Growth companies, especially in the technology sectorThe QQQ has achieved investment in Due to the characteristics of its component stocks and their past performance, the QQQGrowth Company Concentrated ETFsIt is positioned as a
What are the components of the QQQ?
The main components of the QQQ (the top 20 stocks) are as follows
The top 10 stocks in the list are dominated by prominent high-tech companies, including GAFAM in the U.S., with a weighting of about 501 TP3T in the top 10 stocks and about 651 TP3T in the top 20 stocks.
| No | Included stocks | ticker | Percentage of total assets (%) |
|---|---|---|---|
| 1 | Microsoft | MSFT | 8.63 |
| 2 | NVIDIA | NVDA | 8.27 |
| 3 | apple | AAPL | 7.72 |
| 4 | the Amazon | AMZN | 5.49 |
| 5 | broadcom | AVGO | 4.56 |
| 6 | Meta Platforms | META | 3.56 |
| 7 | Netflix | NFLX | 3.19 |
| 8 | tesla | TSLA | 3.16 |
| 9 | Costco | COST | 2.84 |
| 10 | Alphabet (A) | GOOGL | 2.54 |
| 11 | Alphabet (C) | GOOG | 2.41 |
| 12 | palantir | PLTR | 1.73 |
| 13 | T-Mobile | TMUS | 1.73 |
| 14 | Cisco Systems | CSCO | 1.58 |
| 15 | linde | LIN | 1.36 |
| 16 | Intuitive Surgical | ISRG | 1.21 |
| 17 | intelligent | INTU | 1.17 |
| 18 | Adobe (company) | ADBE | 1.13 |
| 19 | Advanced Micro Devices, Inc. | AMD | 1.13 |
| 20 | PepsiCo | PEP | 1.12 |
See also:Holdings & Sector Allocations of Invesco QQQ | Invesco US
What are the QQQ sector ratios?
The Technology (Information Technology) sector has a high percentage, exceeding 501 TP3T.
| sector name | Composition ratio |
|---|---|
| information technology | 57.23% |
| general consumer goods | 19.66% |
| health care | 5.80% |
| capital goods | 5.14% |
| Communication Services | 4.77% |
| necessities | 3.28% |
| raw materials | 1.83% |
| public utilities | 1.44% |
| energy | 0.62% |
| real estate | 0.23% |
See also:Holdings & Sector Allocations of Invesco QQQ | Invesco US
How does the QQQ operation work?
The QQQ is managed using the "full replication method," in which it actually holds the component stocks of the NASDAQ-100 Index.
This method aims to achieve the same performance as the index by holding the same stocks as the index components and in the same proportions.
The QQQ always maintains an equal composition and linkage with the index by rebalancing its portfolio in response to changes in the index components and ratios.
What is QQQ's expense ratio?
QQQ's expense ratio is 0.20% per annum
This compares to the average expense ratio for the ETF industry as a whole (about 0.371 TP3T) and the average for similar large-cap growth ETFs (about 0.611 TP3T),low-levelIn the case of the "M" series, the "M" series is the first one.
This expense ratio includes the ETF's investment management and other operating costs, which are automatically deducted from the investor's holdings.
For example, an investment of $10,000 per year would result in an annual expense of $20.
What is QQQ's dividend yield?
QQQ's dividend yield is approximately 0.591 TP3T
This figure is based on an annual dividend of $2.99 as of May 2025.
Payment frequency is four times a year (quarterly)
Although the dividend yield is low, it is considered an attractive option for investors who value capital gains (profit on price appreciation).
QQQ's current share price and long-term chart
What is the difference between QQQ and QQQM? Which should I choose?
QQQ has a similar sibling ETF.
Official name,
- QQQ (Invesco QQQ Trust, Series 1)
- QQQM (Invesco NASDAQ 100 ETF: Invesco NASDAQ 100 ETF)
Both QQQ and QQQM are ETFs linked to the NASDAQ 100 Index, with the following differences
Difference in Expense Ratio
QQQM has a lower expense ratio of 0.151 TP3T per annum compared to QQQ's 0.201 TP3T per annumThe company has been
In long-term investments, differences in expense ratios may affect returns.
Difference in purchase price per unit
As for the unit price per purchase, QQQM is about half lower, and QQQM is easier to start investing with a smaller amount.
Difference in liquidity
The QQQ's average daily trading volume is higher than that of the QQQM and it has superior liquidity. The QQQ is more suitable for investors who focus on short-term trading.
Difference in Setup Date
QQQMarch 10, 1999The QQQM is a historic ETF established inOctober 13, 2020It is a relatively new ETF set up in
Structural differences
QQQQ is a unit investment trust (UIT) structure and QQQM is an open-ended ETF; QQQM allows for reinvestment of dividends, providing greater investment flexibility.
Points to consider when making a selection
- QQQQSuitable for investors who are interested in short-term transactions that require a high level of liquidity.
- QQQMSuitable for long-term, investment-oriented investors who wish to invest from small amounts with low expense ratios.
Since both ETFs are linked to the same index, the basic investment objective is the same, but it is better to take the above differences into account when making investment decisions.
What is the difference between QQQJ and QQQS?
In addition, there are two sibling ETFs, QQQJ and QQQS
Both of these funds similarly target companies listed on the NASDAQ market, but there are differences in the size of the companies in which they invest and their selection criteria.
QQQJ
- formal nameQQQJ (Invesco NASDAQ Next Gen 100 ETF: Invesco NASDAQ Next Gen 100 ETF)
- Investment Target: The NASDAQ-100 Index covers the 100 companies in the non-financial industry listed on the NASDAQ market that rank second to the NASDAQ-100 Index (101st to 200th) in terms of market capitalization.
- Number of component stocksApproximately 100 companies
- Expense Ratio0.15%
- featureThe Fund consists mainly of mid-cap growth stocks and aims to invest in a group of companies that are expected to be included in the NASDAQ-100 Index in the future.
QQQS
- formal nameQQQQS (Invesco NASDAQ Future Gen 200 ETF: Invesco NASDAQ Future Gen 200 ETF)
- Investment Target: The NASDAQ-100 Index and the NASDAQ Next Generation 100 Index include 200 companies from non-financial industries listed on NASDAQ that are not included in the NASDAQ-100 Index and the NASDAQ Next Generation 100 Index and whose patent portfolios are considered to be of high value.
- Number of component stocksApproximately 200 companies
- Expense Ratio0.75%
- feature: The Fund consists mainly of small-cap stocks and aims to invest in companies with innovative technology and intellectual property.
Comparison chart of the differences between QQQ, QQQM, QQQJ, and QQQS
| (data) item | QQQQ | QQQM | QQQJ | QQQS |
|---|---|---|---|---|
| Investment Target | NASDAQ-100 Index (Top 100 companies) | NASDAQ-100 Index (Top 100 companies) | Next to NASDAQ-100, 100 mid-cap companies | 200 small-cap companies with high patent value |
| Number of component stocks | Approx. 100 companies | Approx. 100 companies | Approx. 100 companies | Approx. 200 companies |
| Expense Ratio | 0.20% | 0.15% | 0.15% | 0.75% |
| feature | Concentration in large-cap growth stocks | For long-term investment with low expense ratio | Future NASDAQ-100 candidate center | Focus on companies with innovative technology and intellectual property |
| Suitable Investors | Short-term trading and liquidity-oriented | Medium- to long-term accumulation orientation | Growth-oriented, medium risk tolerance | Focus on innovation and high risk tolerance |
What are the advantages of investing in QQQ?
The main advantages of investing in QQQ are as follows
High growth and return track record
The QQQ has outperformed the S&P 500 over the past 10 years with an average annualized return of 18.281 TP3T.
Concentrated investment in key technology companies
QQQ invests in the world's leading technology companies, including Apple, Microsoft, NVIDIA, Amazon, and Alphabet (Google), which account for approximately 50% of its portfolio.
Low-cost operation
QQQ's expense ratio is 0.201 TP3T per annum, which is lower than the average expense ratio for the ETF industry as a whole (approximately 0.371 TP3T) and the average for similar large growth ETFs (approximately 0.611 TP3T).
High liquidity and ease of trading
QQQ is one of the most heavily traded ETFs in the U.S. market, and its high liquidity allows for rapid trading at near market prices.
Access to innovative companies
On average, QQQ components spend about 1.3 times more on R&D than S&P 500 stocks and include many companies that offer innovative technologies and services.
Affinity with New NISA
The QQQ is also suitable as a growth investment limit under the new NISA because it allows investors to invest in companies with high growth potential. It is an attractive option for investors seeking long-term asset building by taking advantage of the tax exemption.
What are the factors behind the article "QQQ is not recommended" and the many searches for it?
The following factors contribute to the opinion that "QQQ is not recommended."
Risks from Sector Concentration
QQQ is heavily concentrated in certain sectors, with approximately 601 TP3T invested in the information technology sector. This may increase the overall risk of the portfolio as it is susceptible to downturns in the technology industry and increased regulation.
High volatility
The QQQ is composed mainly of growth stocks and is sensitive to market expectations. As a result, price volatility tends to increase with changes in interest rates and the release of economic indicators. In particular, growth stocks tend to be sold off during periods of rising interest rates, and there is a risk that the price of the QQQ will also fall.
Low dividend yield
QQQ's low dividend yield of approximately 0.681 TP3T makes it less attractive to investors who value income gains. This is because many of the component stocks do not emphasize dividends and prioritize reinvestment in growth.
High investment unit price
The price per share of QQQ is as high as about $530 (about 80,000 yen), which can make it difficult to invest from a small amount. Especially for novice investors and investors with limited funds, the hurdle to purchase seems high.
Existence of foreign exchange risk
Since QQQ is a U.S. dollar-denominated ETF, it is subject to currency fluctuations; not only for QQQ but also for other dollar-denominated ETFs, a stronger yen may cause a diminution in the value of assets in dollar terms, resulting in lower returns in yen terms.
Possibility of double taxation
Dividends received from QQQ are subject to withholding tax of 101 TP3T in the US and then 20.3151 TP3T in Japan. This may result in a decrease in real dividend income.
Due to these factors, while investing in QQQs can aim for high returns, it also entails the disadvantages and risks described above. Therefore, it is not generally recommended for all investors.
What is the best time to invest in QQQ?
Although the timing of investment in QQQ depends on investment objectives and market conditions, the following points are provided for reference.
Effectiveness of Accumulation in Long-Term Investments
Regular accumulation investment (dollar cost averaging) is effective for long-term asset building. It is not affected by short-term fluctuations in the market and is expected to have the effect of equalizing the unit price of purchases.
QQQQ, in particular, has averaged annual returns of 18.441 TP3T over the past 10 years and is expected to grow as an investment for the long-term perspective. Therefore, rather than focusing on investment timing,Long-term holding through continuous accumulationis an effective strategy.
Purchase during market correction phase
When the market is in an adjustment phase, the price of the QQQ may fall.
Purchasing at such a time has the potential to enhance future returns, but it is difficult to accurately predict the bottom of the market, so prudent judgment is required.
Impact of overall market trends and interest rates
Because of its heavy weighting in the technology sector, QQQ is sensitive to rising interest rates and fluctuations in economic indicators. In particular, growth stocks tend to sell off when interest rates are rising, which may cause the price of the QQQ to fall. Therefore, decisions should be made in light of interest rate trends and the timing of economic indicator releases.
In light of the above, when considering the timing of an investment in QQQ, it is important to consider the market environment and one's own investment objectives comprehensively, while keeping a long-term perspective.
Can QQQQ be selected as a Nisa target?
QQQ is,Products eligible for the "Growth Investment Limit" of the new NISA systemIt is possible to invest as
But there are alternatives.
Alternative: NASDAQ 100-linked ETF listed in Japan
If you wish to avoid currency risk or prefer to trade in Japanese yen, one option is to consider NASDAQ 100-linked ETFs listed on the domestic market.
The following is a summary of NASDAQ 100-linked ETFs listed in Japan.
| brand name | stock code | exchange hedge | Trust fees (annualized) | Investment Company |
|---|---|---|---|---|
| Listed Index Fund U.S. Equity (NASDAQ 100) No Currency Hedged | 2568 | nashi (Pyrus pyrifolia, esp. var. culta) | Within 0.251 TP3T | Nikko Asset Management |
| Listed Index Fund U.S. Equity (NASDAQ 100) with currency hedge | 2569 | ant | Within 0.251 TP3T | Nikko Asset Management |
| NEXT FUNDS NASDAQ-100® (no currency hedging) Exchange Traded Fund | 1545 | nashi (Pyrus pyrifolia, esp. var. culta) | Within 0.20% | Nomura Asset Management Co. |
| MAXIS NASDAQ 100 Exchange Traded Fund | 2631 | nashi (Pyrus pyrifolia, esp. var. culta) | About 0.20% | Mitsubishi UFJ Asset Management Co. |
| MAXIS NASDAQ 100 Exchange Traded Fund (Currency Hedged) | 2632 | ant | About 0.20% | Mitsubishi UFJ Asset Management Co. |
| iFreeETF NASDAQ100 (no currency hedge) | 2840 | nashi (Pyrus pyrifolia, esp. var. culta) | Within 0.10% | Daiwa Asset Management Co. |
| iFreeETF NASDAQ100 (currency hedged) | 2841 | ant | Within 0.10% | Daiwa Asset Management Co. |
| NZAM Listed Investment Trust NASDAQ 100 (Currency Hedged) | 2087 | ant | Within 0.20% | Norinchukin Zenkyoren Asset Management |
These ETFs are,General NISA's "Growth Investment Limit"The ability to invest in a single asset and the ability to invest in a single asset, make it a viable option for investors seeking to build long-term assets.
However, it is important to understand the characteristics of each ETF, such as the presence or absence of currency hedging and trust fees, and to select according to one's investment objectives and risk tolerance.
Which NASDAQ 100-linked ETFs listed in Japan are eligible for the reserve NISA?
The iFreeNEXT NASDAQ100 Index is the first mutual fund in Japan linked to the NASDAQ100 Index as an eligible product for the "nasaitate NISA" system.
The product has been added as an eligible product for the reserve NISA as of October 5, 2023.
Main Features
- Support for both the reserve NISA and the growth investment limitThis fund can be invested in both the "reserve investment limit" and the "growth investment limit" of the "nasate NISA".
- Invests in leading U.S. technology companies: The NASDAQ 100 Index consists of stocks of 100 non-financial companies with large market capitalization listed on the NASDAQ market in the U.S., including companies such as Apple, Microsoft, Amazon, Alphabet (Google), and NVIDIA.
- Products suitable for long-term asset building: Past simulations have shown that higher returns can be expected from long-term savings investments.
What is the difference between QQQ and VOO/VGT?
When considering QQQ, it is often compared well with VOO and VGT as similar ETFs.
QQQ, VOO, and VGT are all popular ETFs in the U.S. market, but there are distinct differences in their investment objectives and characteristics.
Below is an overview of each ETF and its main differences.
Overview of each ETF
| (data) item | QQQQ | VOO | VGT |
|---|---|---|---|
| formal name | Invesco QQQ Trust | Vanguard S&P 500 ETF | Vanguard Information Technology ETF |
| settlement day | March 1999 | September 2010 | January 2004 |
| Investment Company | Invesco | Vanguard | Vanguard |
| Expense Ratio | 0.20% | 0.03% | 0.10% |
| Number of component stocks | Approx. 100 issues | Approx. 500 stocks | Approx. 300 issues |
| Main Investment Targets | NASDAQ-100 Index | S&P 500 Index | U.S. Information Technology Sector |
| Sector Ratio | Information technology about 541 TP3T, telecommunications about 171 TP3T, consumption about 151 TP3T | Information Technology approx. 301 TP3T, Medical approx. 131 TP3T, Financial approx. 111 TP3T | Information technology approx. 921 TP3T, telecommunications approx. 31 TP3T, industry approx. 31 TP3T |
| dividend yield | Approx. 0.59% | Approx. 1.65% | Approx. 0.54% |
| 10-year average annual return | Approx. 17.42% | Approx. 12.51% | Approx. 19.68% |
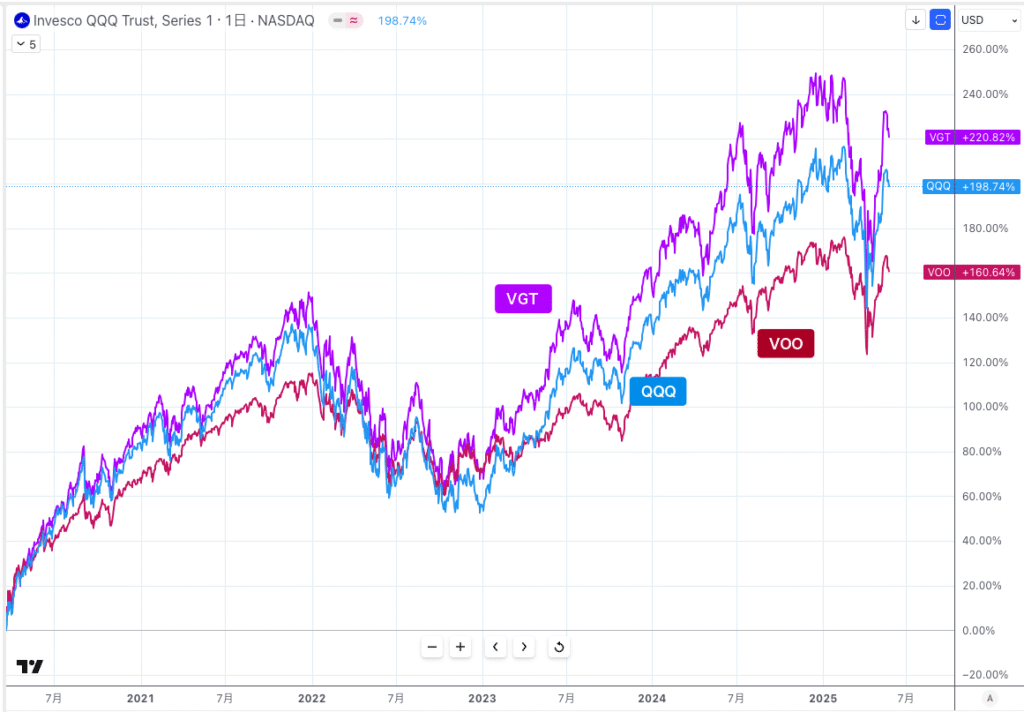
Below is a graph comparing the performance of QQQ, VGT, and VOO.
The period is the performance since the March 2020 Corona shock.
- QQQ, but +198%
- VGT is +220%
- VOO, +160%.
and VGT was the best performing result for this period.
Main differences and features
QQQ: Intensive investment in growth companies
- Investment TargetNASDAQ-100: Invests primarily in large U.S. growth companies, tracking the NASDAQ-100 index.
- Sector Composition: A high proportion of the Information Technology sector, which also includes telecommunications and consumer-related sectors.
- featureWhile high growth potential is expected, there are also risks due to sector concentration.
VOO: Diversified investment in the entire U.S. market
- Investment TargetThe Fund invests in a broadly diversified portfolio of 500 large-cap U.S. stocks linked to the S&P 500 Index.
- Sector CompositionDiversified into diverse sectors including: information technology, healthcare, and finance.
- featureFor long-term investments that aim for stable returns at low cost.
VGT: Specialized Investment in the Information Technology Sector
- Investment TargetETF: An ETF specializing in the U.S. information technology sector.
- Sector Composition: The Information Technology sector accounts for about 921 TP3T.
- featureHigh returns are expected, but there is also a high level of risk due to sector specialization.
Recommendation by type
- Investors seeking high growth potential: QQQQ and VGT are suitable.
- Investors who value stable returns and diversification: VOO is suitable.
- Investors wishing to invest specifically in the information technology sector: VGT is suitable for this purpose.
What similar ETFs are often compared to QQQ?
ETFs with similar characteristics that are often compared to QQQ include the following
Comparison of major ETFs similar to QQQ
| ticker | name | Investment Target | Expense Ratio | feature |
|---|---|---|---|---|
| VGT | Vanguard Information Technology Sector ETF | U.S. Information Technology Sector | 0.10% | Specializes in the technology sector and is more broadly diversified than QQQQ. |
| XLK | Technology Select Sector SPDRs | Information Technology Sector of the S&P 500 | 0.10% | Specializes in the information technology sector of the S&P 500 constituents. |
| SPY | SPDR S&P 500 ETF Trust | S&P 500 Index | 0.09% | Broadly diversified investment in 500 large-cap U.S. stocks. |
| VOO | Vanguard S&P 500 ETF | S&P 500 Index | 0.03% | Similar investment objectives as SPY, but lower cost. |
| IV | iShares Core S&P 500 ETF | S&P 500 Index | 0.03% | Similar investment objectives as VOO, managed by iShares. |
| VUG | Vanguard Growth ETF | U.S. large-cap growth stocks | 0.04% | Specializes in growth stocks and aims for performance similar to QQQ. |
| QQE | Direction Nasdaq 100 Equal Weight ETF | NASDAQ 100 Index (equal weight) | 0.35% | Equal inclusion of each component reduces bias toward specific stocks. |
| TQQQ | ProShares UltraPro QQQ | 3x leverage on the NASDAQ 100 Index | 0.95% | High-risk/high-return ETFs for investors looking for short-term price volatility. |
| PSQ | ProShares Short QQQ | NASDAQ 100 Index in reverse direction | 0.95% | A contrarian ETF that targets profits when the NASDAQ 100 Index declines. |
| JEPQ | JP Morgan Nasdaq Premium Income ETF | Invests in large-cap stocks, primarily the NASDAQ 100 Index, and utilizes a covered call strategy | 0.35% | Monthly distributions while offering a high dividend yield (approximately 11.41 TP3T). Potential to limit returns during market rallies, but expected to have a mitigating effect during market declines. |
Features and selection points of each ETF
- VGT: Specializing in the Information Technology sector, rather than QQQDiversified investments in a wide range of technology companiesis possible.
- XLK: from among the S&P 500 constituents.Investments focused on the information technology sectorcan be made.
- SPY / VOO / IVV: U.S.A.Broadly diversified investment in 500 large-cap stocksBy doing,Aim for stable returnsThe following is a list of the most common problems with the "C" in the "C" column.
- VUG:Specializing in growth stocksand QQQ andSimilar PerformancePursue the
- QQE: NASDAQ 100 Index.Equal inclusion of each componentBy doing so, the dependence on specific stocks is reduced,diversify riskThe following is a list of the most common problems with the "C" in the "C" column.
- TQQQ / PSQ:Short-term market movementsto capture theleveraged typeandreverse side-by-side ETFandHigh risk.The following is a list of the most common problems with the "C" in the "C" column.
- JEPQ: while investing in large-cap stocks linked to the NASDAQ 100,covered call strategyBy using theHigh dividend yield (approx. 111 TP3T) and monthly distributionsRealization of theExpected to have a mitigating effect when prices fallOn the other hand, it should be noted that returns are limited on the upside.
While investing in growth companies in the NASDAQ 100,JEPQ is also a strong option if you want to focus on dividendsThe first is the "A" in the "A" column.
Although price gains (capital gains) like QQQ are limited,Stable high dividends and monthly distributionsis the attraction,Compounding effect of dividend reinvestmentcan be expected.
This ETF is suitable for long-term investors who value stable income.
Which brokerage firm can I buy QQQ shares?
The following is a list of major brokerage firms that offer QQQ stock.
| Popular Brokerage Firms | stock trading |
|---|---|
| SBI Securities | Fat. |
| Matsui Securities Co. | Fat. |
| Rakuten Securities, Inc. | Fat. |
| Monex, Inc. | Fat. |
| Mitsubishi UFJ e-Smart Securities | Fat. |
| DMM Stock | ✕ |
| Saxo Bank Securities | Fat. |
| IG Securities | ✕ |
| GMO CLICK Securities, Inc. | ✕ |
| moomoo Securities | Fat. |
summary
This article details the features of QQQQ, which is linked to the NASDAQ 100 Index and allows investors to concentrate on leading U.S. high-tech growth companies, as well as the advantages and disadvantages of investing and how it compares to other ETFs.
While the QQQ is suitable for medium- to long-term asset building targeting high growth potential, it also entails risks such as sector bias and high volatility.
On the other hand, there are options like QQQM that can be linked to the same index but at a lower cost, ETFs like VGT and XLK that are more specialized in technology, ETFs like VOO and IVV that seek broader diversification, and even ETFs that incorporate high-dividend strategies like JEPQ.
Each ETF has distinct differences in investment objectives, risk, and return structure, so it is important to select the appropriate ETF according to your objectives and risk tolerance.
Identifying ETFs that are consistent with your own investment policy, rather than simply selecting them "because they are popular," will lead to successful long-term asset building. Please refer to the following information.
I'm making use of it too! Get the most out of moomoo securities!
I am.moomoo SecuritiesWhat I like most about using the app is that it is easy to use and makes it easy to gather in-depth information, which is important in investing.
Further,Ability to see trends of large and medium investors.and it has been very helpful in considering the future of the stocks.A wealth of news and earnings-related information on each stock, with support for automatic Japanese translationThe company is also happy to provide instant access to information from overseas.
Moomoo Securities also has the lowest U.S. stock trading commissions.
Interested parties can easily register through this banner link!